安裝請參考
Grafana 設定
1. Datasource
> add > Prometheus > url ${http://172.28.1.3:9090} > Save & Test
2. Users
Invite > ${email}
3. Plugins
Pie Chart
4. Dashboards
Grafana 資源
Grafana Dashboard
Grafana Plugins
套用別人建立好的 Dashboard
在 https://grafana.com/grafana/dashboards 過濾 Data Source 為 Prometheus 的套件
找到適合的套件記下 ID

在自己的 Grafana => Create => Import

5. import! Alerting
參考資料
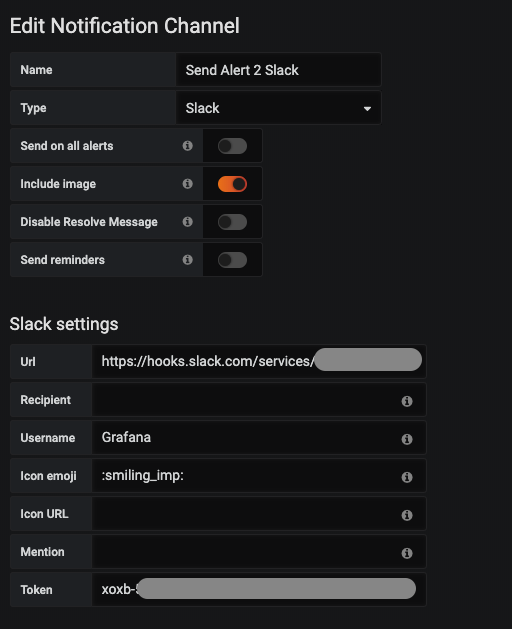
add notification channel
use slack as example (Slack 新增 app 請參考)
取得 App Token
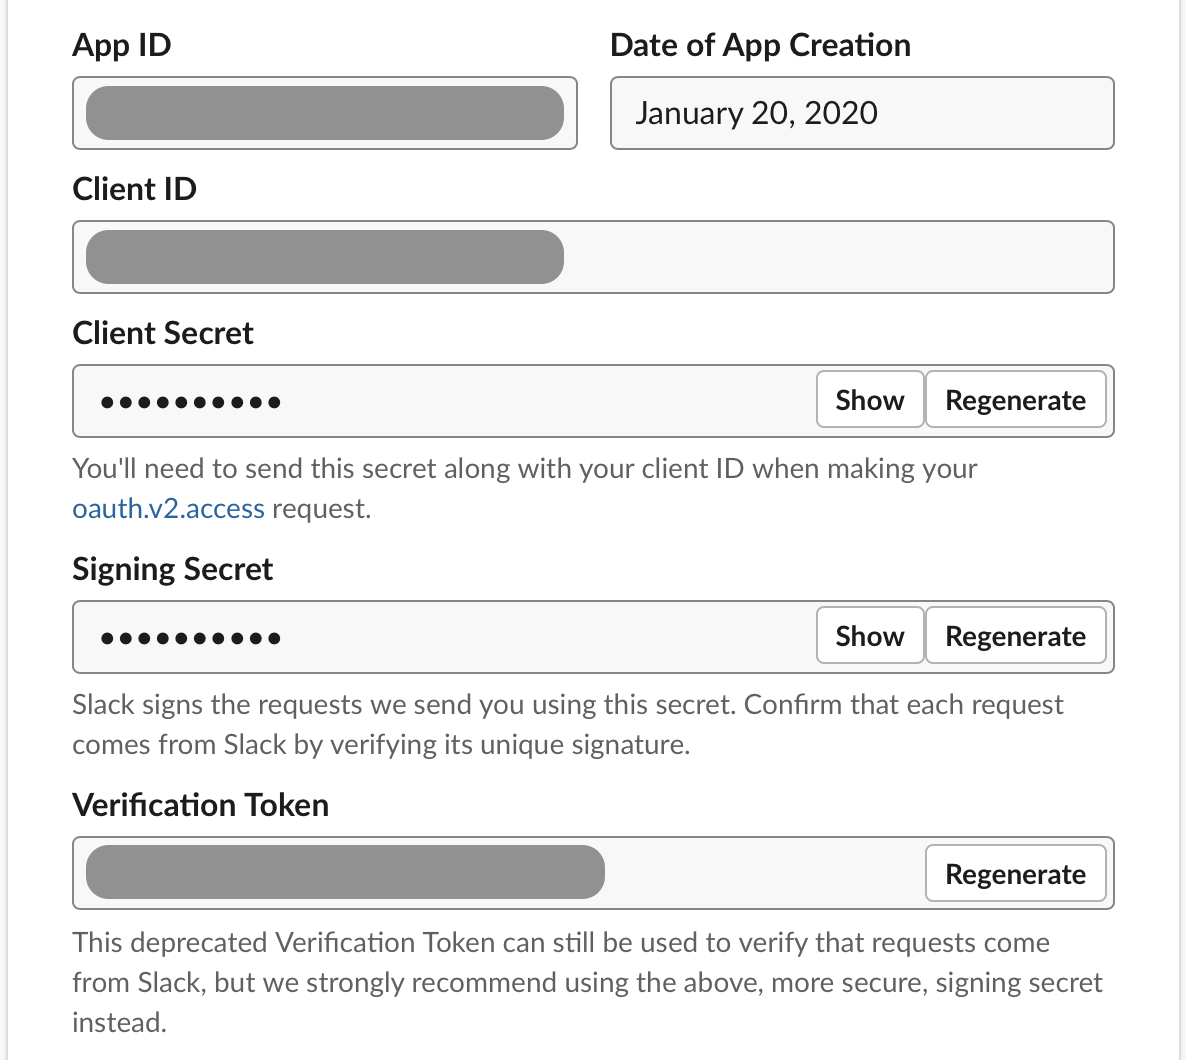
取得 Incoming Webhooks URL
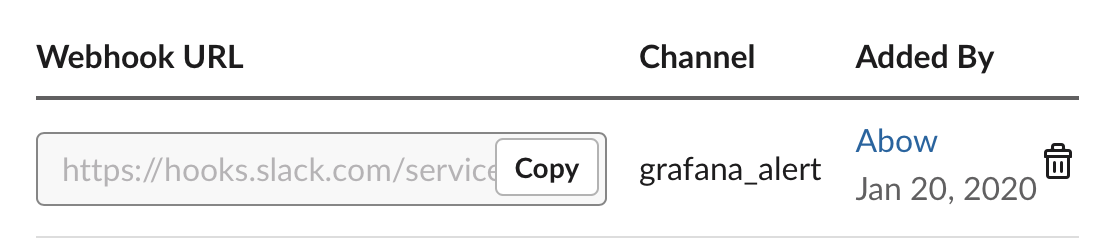
填入 URL ${webhook URL} & token
token 為 xoxb-
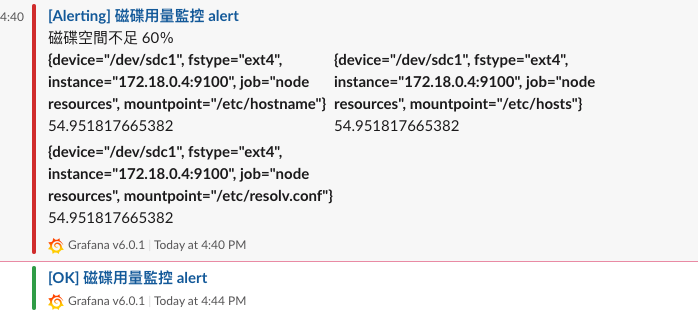
6. 建立磁碟空間警報
Add Panel > Add Query
# Queries
(node_filesystem_avail_bytes/node_filesystem_size_bytes) * 100
# Visualization # import ! user "Graph"
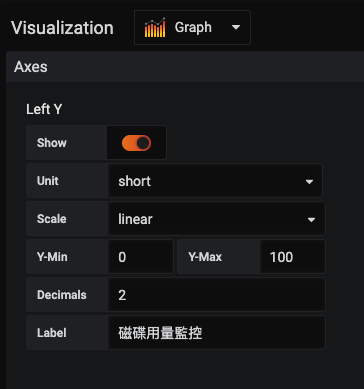 # Alert

just like this
留言
張貼留言